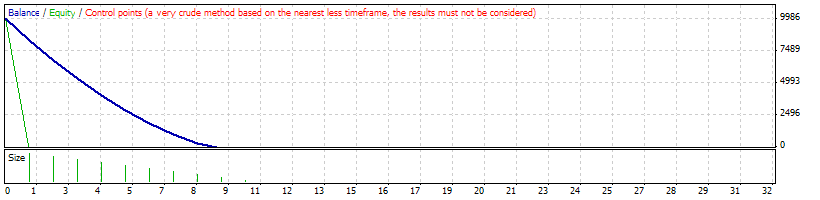
Strategy Tester Report
EA_supercharger 2
AlpariUK-Demo (Build 225)
| Symbol | USDCAD (US Dollar vs Canadian Dollar) | ||||
| Period | 1 Hour (H1) 2009.01.05 17:00 - 2009.12.31 18:00 (2009.01.01 - 2010.01.01) | ||||
| Model | Control points (a very crude method, the results must not be considered) | ||||
| Parameters | Lots=0.1; StopLoss=0; StopLossOnTenth=0; Use_Auto_TakeProfit=false; TakeProfit=0; TrailingStop=5; MaxTrades=10; Pips=20; SecureProfit=10; AccountProtection=1; OrderstoProtect=3; ReverseCondition=0; EURUSDPipValue=10; GBPUSDPipValue=10; USDCHFPipValue=7.94; USDJPYPipValue=9.03; mm=0; risk=12; AccountisNormal=1; TimeZoneofData=0; | ||||
| Bars in test | 6211 | Ticks modelled | 152607 | Modelling quality | n/a |
| Mismatched charts errors | 70 | ||||
| Initial deposit | 10000.00 | ||||
| Total net profit | -10411.14 | Gross profit | 0.00 | Gross loss | -10411.14 |
| Profit factor | 0.00 | Expected payoff | -1041.11 | ||
| Absolute drawdown | 10411.14 | Maximal drawdown | 18296.26 (102.30%) | Relative drawdown | 102.30% (18296.26) |
| Total trades | 10 | Short positions (won %) | 10 (0.00%) | Long positions (won %) | 0 (0.00%) |
| Profit trades (% of total) | 0 (0.00%) | Loss trades (% of total) | 10 (100.00%) | ||
| Largest | profit trade | 0.00 | loss trade | -1690.49 | |
| Average | profit trade | 0.00 | loss trade | -1041.11 | |
| Maximum | consecutive wins (profit in money) | 0 (0.00) | consecutive losses (loss in money) | 10 (-10411.14) | |
| Maximal | consecutive profit (count of wins) | 0.00 (0) | consecutive loss (count of losses) | -10411.14 (10) | |
| Average | consecutive wins | 0 | consecutive losses | 10 | |
| # | Time | Type | Order | Size | Price | S / L | T / P | Profit | Balance |
| 1 | 2009.01.05 17:02 | sell | 1 | 0.10 | 1.18707 | 0.00000 | 0.00000 | ||
| 2 | 2009.01.05 17:05 | sell | 2 | 0.20 | 1.18755 | 0.00000 | 0.00000 | ||
| 3 | 2009.01.05 17:10 | sell | 3 | 0.30 | 1.18896 | 0.00000 | 0.00000 | ||
| 4 | 2009.01.05 17:15 | sell | 4 | 0.40 | 1.19038 | 0.00000 | 0.00000 | ||
| 5 | 2009.01.05 17:20 | sell | 5 | 0.50 | 1.19180 | 0.00000 | 0.00000 | ||
| 6 | 2009.01.05 17:45 | sell | 6 | 0.60 | 1.19260 | 0.00000 | 0.00000 | ||
| 7 | 2009.01.05 17:50 | sell | 7 | 0.70 | 1.19410 | 0.00000 | 0.00000 | ||
| 8 | 2009.01.06 05:50 | sell | 8 | 0.80 | 1.19478 | 0.00000 | 0.00000 | ||
| 9 | 2009.01.06 06:03 | sell | 9 | 0.90 | 1.19520 | 0.00000 | 0.00000 | ||
| 10 | 2009.01.06 06:10 | sell | 10 | 1.00 | 1.19587 | 0.00000 | 0.00000 | ||
| 11 | 2009.01.12 19:20 | close at stop | 10 | 1.00 | 1.21639 | 0.00000 | 0.00000 | -1690.49 | 8309.51 |
| 12 | 2009.01.12 19:20 | close at stop | 9 | 0.90 | 1.21639 | 0.00000 | 0.00000 | -1571.02 | 6738.50 |
| 13 | 2009.01.12 19:20 | close at stop | 8 | 0.80 | 1.21639 | 0.00000 | 0.00000 | -1424.07 | 5314.42 |
| 14 | 2009.01.12 19:20 | close at stop | 7 | 0.70 | 1.21639 | 0.00000 | 0.00000 | -1285.61 | 4028.81 |
| 15 | 2009.01.12 19:20 | close at stop | 6 | 0.60 | 1.21639 | 0.00000 | 0.00000 | -1175.94 | 2852.87 |
| 16 | 2009.01.12 19:20 | close at stop | 5 | 0.50 | 1.21639 | 0.00000 | 0.00000 | -1012.84 | 1840.04 |
| 17 | 2009.01.12 19:20 | close at stop | 4 | 0.40 | 1.21639 | 0.00000 | 0.00000 | -856.97 | 983.07 |
| 18 | 2009.01.12 19:20 | close at stop | 3 | 0.30 | 1.21639 | 0.00000 | 0.00000 | -677.74 | 305.32 |
| 19 | 2009.01.12 19:20 | close at stop | 2 | 0.20 | 1.21639 | 0.00000 | 0.00000 | -475.01 | -169.69 |
| 20 | 2009.01.12 19:20 | close at stop | 1 | 0.10 | 1.21639 | 0.00000 | 0.00000 | -241.45 | -411.14 |